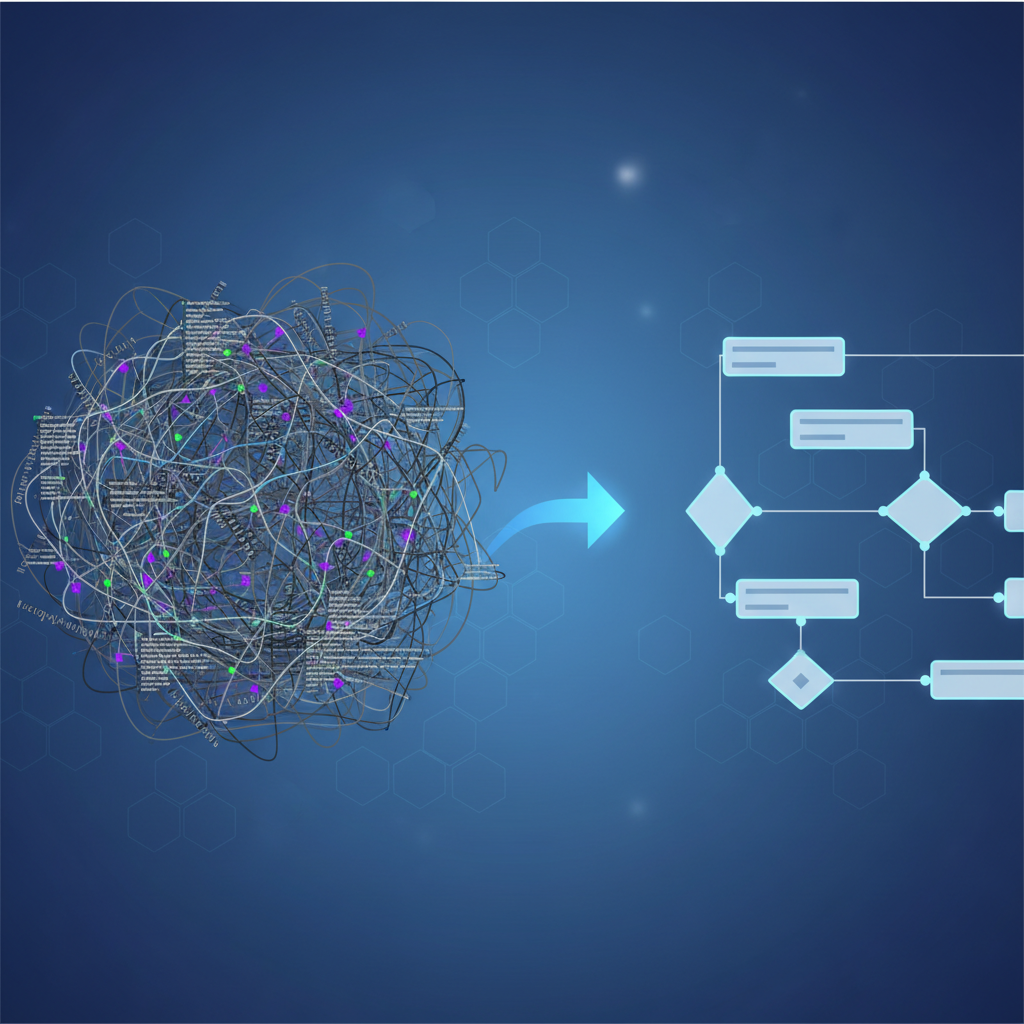
Have you ever stared at a sprawling GitHub Actions YAML file, feeling your eyes glaze over as you try to trace the flow of jobs, steps, and conditions? You're not alone. CI/CD pipelines, while essential, can quickly become a tangled web of logic, making them difficult to understand, debug, and optimize. It's like trying to navigate a city with only a list of street names, rather than a map.
Imagine you're a new team member joining a project with a critical, multi-stage deployment pipeline defined across several GitHub Actions YAML files. Your task is to add a new security scan step. Without a clear visual representation, you'd spend hours, maybe even days, just understanding the existing structure. What runs in parallel? What depends on what? Where do failures propagate?
The Challenge of CI/CD Complexity
GitHub Actions, with their powerful syntax and extensive capabilities, allow for highly sophisticated workflows. However, this power comes at a cost: readability. As pipelines grow, they accumulate:
Nested Jobs and Steps: Deeply indented structures that are hard to follow.
Conditional Logic:
ifstatements scattered throughout, making execution paths ambiguous.Matrix Strategies: Dynamic job generation that's impossible to predict from static text.
Dependencies: Explicit and implicit relationships between jobs that aren't immediately obvious.
Reusable Workflows: Abstractions that require jumping between files to understand the full picture.
This complexity often leads to:
Slow Onboarding: New developers take longer to grasp the CI/CD landscape.
Increased Debugging Time: Pinpointing the source of a pipeline failure becomes a detective mission.
Error-Prone Modifications: Changing one part of the pipeline can inadvertently break another.
Lack of Shared Understanding: Different team members might have different mental models of the same pipeline.
ArchToCode: Your CI/CD Flowchart Generator
This is where ArchToCode steps in. Our AI-powered code visualization tool is designed to cut through the complexity, transforming your raw GitHub Actions YAML into clear, interactive Mermaid flowcharts. No more squinting at text files; instead, you get a dynamic map of your CI/CD city.
How ArchToCode Illuminates Your GitHub Actions
ArchToCode analyzes your GitHub repository, understanding the intricate relationships within your YAML files, and then generates a visual diagram. Here's how it helps:
Connect Your Repository
First, you connect your GitHub repository to ArchToCode. Our tool securely accesses your files, including your .github/workflows/ directory. You can choose to analyze specific workflow files or let the AI discover them.
Select a Flowchart Prompt
From ArchToCode's extensive library of 30+ built-in prompt templates, you'd select a relevant flowchart template, such as "High-Level Project Flow" or "Function Call Flow." You can even create custom prompts to focus on specific aspects of your CI/CD.
Generate Your CI/CD Flowchart
With a click, ArchToCode's AI processes your YAML. It identifies jobs, steps, dependencies, and conditional logic, then translates this into a Mermaid flowchart. The result is an interactive diagram on your canvas, showing a clear, step-by-step visualization of your pipeline.
Explore and Understand
Once the diagram is generated, you can:
Click Nodes: Select any job or step node to view its details in the right panel, including associated source code snippets.
Trace Connections: Clicking a node highlights all its incoming and outgoing connections, making it easy to see dependencies and understand the flow.
Drill Down: Generate sub-diagrams from a specific job to understand its internal steps in greater detail.
Regenerate from Node: Change your perspective by regenerating the diagram with a specific job as the root.
AI Diagram Explanation: Get a comprehensive, 50+ sentence AI-powered analysis of your diagram, explaining its purpose, data flow, control flow, and key components.
The Benefits of Visualizing Your CI/CD
By transforming your GitHub Actions YAML into readable flowcharts, ArchToCode provides tangible benefits:
Accelerated Onboarding: New team members can quickly grasp complex pipelines, reducing ramp-up time from days to hours.
Faster Debugging: Visually identify bottlenecks, failed steps, and unexpected dependencies. When a build breaks, you can immediately see where the issue lies in the flow.
Improved Collaboration: Foster a shared understanding across your team. Everyone can refer to the same visual map, leading to more productive discussions and fewer misunderstandings.
Safer Modifications: Before making changes, visualize the impact. Understand how adding a new step or altering a condition might affect downstream jobs.
Enhanced Documentation: Export your diagrams as images or Mermaid code to embed directly into your project documentation, keeping it always up-to-date.
Complexity Control: Use ArchToCode's "Generation Settings" to control the complexity and maximum number of nodes in your diagrams. Start with a high-level overview and then drill down into specifics as needed.
Error Recovery: If the AI encounters issues generating a diagram, ArchToCode's robust error recovery system provides AI-powered suggestions and allows you to adjust parameters like complexity and node limits for successful regeneration.
A Concrete Example: The Deployment Pipeline
Consider a typical deployment pipeline:
# .github/workflows/deploy.yml
name: Deploy to Production

on:
  push:
    branches:
      - main
  workflow_dispatch:

jobs:
  build:
    runs-on: ubuntu-latest
    steps:
      - uses: actions/checkout@v4
      - name: Setup Node.js
        uses: actions/setup-node@v4
        with:
          node-version: '20'
      - name: Install dependencies
        run: npm ci
      - name: Build project
        run: npm run build
      - name: Upload artifact
        uses: actions/upload-artifact@v4
        with:
          name: build-artifact
          path: build/

  test:
    runs-on: ubuntu-latest
    needs: build
    steps:
      - uses: actions/checkout@v4
      - name: Download artifact
        uses: actions/download-artifact@v4
        with:
          name: build-artifact
          path: build/
      - name: Run tests
        run: npm test

  deploy:
    runs-on: ubuntu-latest
    needs: test
    if: github.ref == 'refs/heads/main' && success()
    steps:
      - name: Download artifact
        uses: actions/download-artifact@v4
        with:
          name: build-artifact
          path: build/
      - name: Deploy to S3
        run: aws s3 sync build/ s3://my-prod-bucket
      - name: Invalidate CloudFront cache
        run: aws cloudfront create-invalidation --distribution-id ${{ secrets.CLOUDFRONT_DISTRIBUTION_ID }}
Manually, you can see test needs build, and deploy needs test. But what if there were 10 more jobs, complex conditions, and matrix strategies? ArchToCode would instantly render a clear flowchart:
graph TD
    A[Push to main / Manual Trigger] --> B(Build Project)
    B --> C(Run Tests)
    C --> D{Deployment Conditions Met?}
    D -- If Yes --> E(Deploy to S3)
    D -- If No --> F(Deployment Skipped)
    E --> G(Invalidate CloudFront Cache)
This simple example already shows the power of visualization. For complex, real-world pipelines, ArchToCode becomes an indispensable tool.
Take Control of Your CI/CD Workflows
Stop struggling with verbose YAML and start seeing your CI/CD pipelines as they truly are: interconnected processes. ArchToCode provides the clarity you need to manage, debug, and evolve your GitHub Actions with confidence.
Ready to transform your CI/CD understanding? Try ArchToCode today and turn your complex GitHub Actions YAML into intuitive, interactive flowcharts. Don't forget to check out the ArchToCode YouTube channel for more tutorials and insights!